A Gentle Introduction to LLDB for iOS Reversing

Most of my blog posts recently have focused exclusively on the use of tools such as Frida, R2Frida, and Radare2. Each has detailed how I use them for automation scripting when reversing an iOS mobile application.
In this next series, I would like to share my workflow using lldb. The first post will review how to use lldb for reversing a simple iOS application I built in Swift. The second will deal with repeating the same steps using automation by utilizing Python bindings for lldb. I am a proponent of learning by doing when it comes to applying any new skill. Build something and then break it.
A few caveats: This post assumes you have prior coding experience in Swift, you have access to the source code you are debugging, and there is no need to play with ASLR. At a later date, I may write a guide on reversing an iOS game using lldb locally on a jailbroken device. If I am not lazy 💩
Two resources I recommend are the book Advanced Apple Debugging & Reverse Engineering by Walter Tyree and the lldb documentation here. If the reader is so inclined, I included a list of resources for additional reading.
Swift Code
The iOS application I built is simple. It performs some basic functionality such as printing a String or an array, a calculation of two numbers, a Boolean comparison operation, a String comparison, and uses a lower-level C function call to print a String. When time allows, I may add other components to this app, such as a struct and an enum value type to modify. Note this can be used either on a Simulator or a physical iOS device.
One challenge I faced is needing to use static variables in this Swift program rather than declaring the initial variables via the let or var keywords exclusively. I found when I did, I was unable to modify the reference to these variables, and likely the real values are found at an address location via a copy of the variable. More to come on this topic…
Let’s dig into each of the function calls and operations. The first is a function to print a statement in Swift.
    static var debugMessage: String = ""
    @inline(never)
    static func printStatement() {
        // load into static
        debugMessage = "🟢 This is a debug print statement."
        // you can patch debugMessage in LLDB before this line…
        print(debugMessage)
    }
The second performs a mathematical operation of multiplying two Ints and then adding the value 5 to them.
    static var debugX: Int = 0
    static var debugY: Int = 0
    static var debugMathResult: Int = 0
    @inline(never)
    static func mathOperation() {
        // initialize statics
        debugX = 42
        debugY = 8
        // patch before computing
        debugMathResult = (debugX * debugY) + 5
        print("🧮 Math result: \(debugMathResult) (x=\(debugX), y=\(debugY))")
    }
The third iterates through an array of fruits and then prints them out using a for loop.
    static var debugFruits: [String] = []
    static var debugFruitIndex: Int = 0
    @inline(never)
    static func parseArray() {
        // load into static array
        debugFruits = ["apple", "banana", "cherry", "date"]
        // you can modify debugFruits or debugFruitIndex in LLDB
        for fruit in debugFruits {
            print("🍓 Found fruit: \(fruit)")
        }
    }
The fourth prints a debug statement from our bridged C code.
    static var debugCString: String = ""
    @inline(never)
    static func printCString() {
        guard let cStringPtr = getHelloString() else {
            print("Failed to get C string.")
            return
        }
        // bridge and store
        debugCString = String(cString: cStringPtr)
        // you can patch debugCString here if you like
        print("🧵 From C: \(debugCString)")
    }
The fifth does a Bool comparison against two Ints.
    static var debugA: Int = 0
    static var debugB: Int = 0
    static var debugResult: Int = 0
    @inline(never)
    static func alwaysTrue() -> Bool {
        debugA = 10
        debugB = 20
        debugResult = debugA + debugB
        let isPositive = debugResult > 0
        print("🔁 alwaysTrue() evaluated to: \(isPositive) (a=\(debugA), b=\(debugB), res=\(debugResult))")
        return isPositive
    }
The sixth does a String comparison against two variables and prints out whether they are equal or not.
    static var debugFirst: String = ""
    static var debugSecond: String = ""
    @inline(never)
    static func compareStrings(_ a: String, _ b: String) {
        debugFirst = a
        debugSecond = b
        let areEqual = debugFirst == debugSecond
        print(
            areEqual
            ? "✅ Strings are equal: \"\(debugFirst)\" == \"\(debugSecond)\""
            : "❌ Strings are NOT equal: \"\(debugFirst)\" != \"\(debugSecond)\""
        )
    }
Application Overview
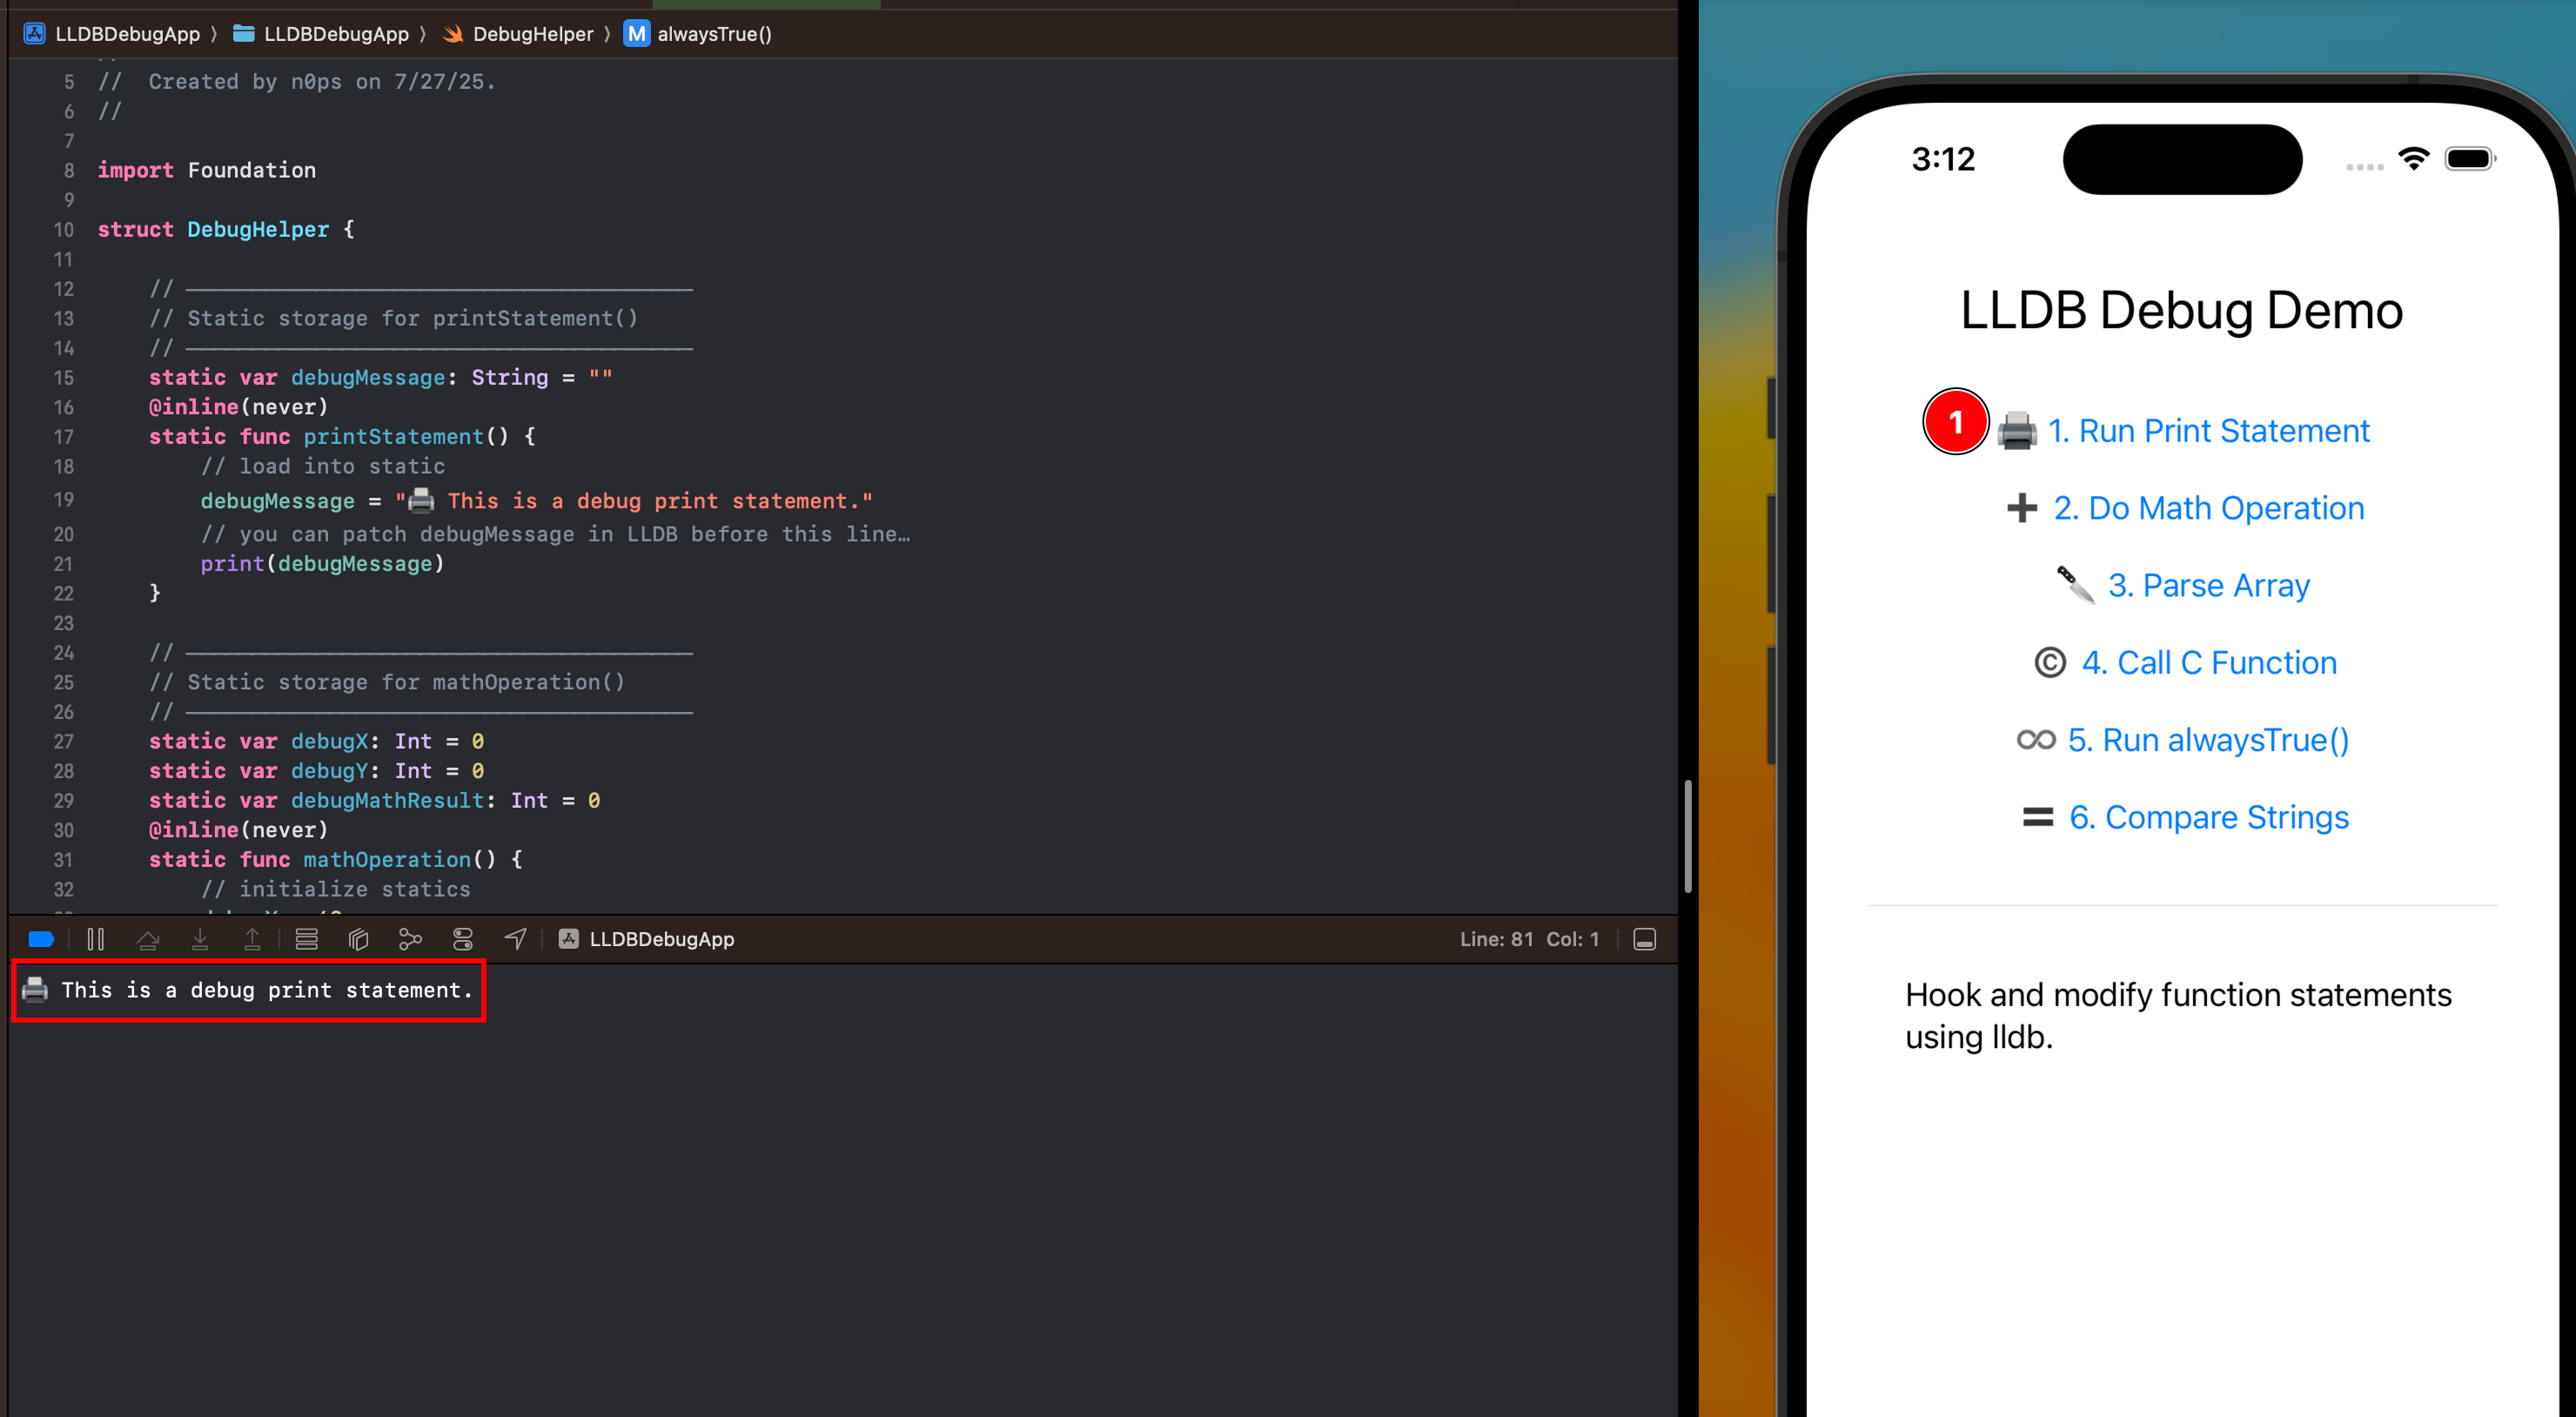
Quickly, reviewing the application at runtime, the user presses one of the available buttons in the app. After the button is pressed, some basic logic will be performed app side, and the resultant output from the code block will display the print statement.
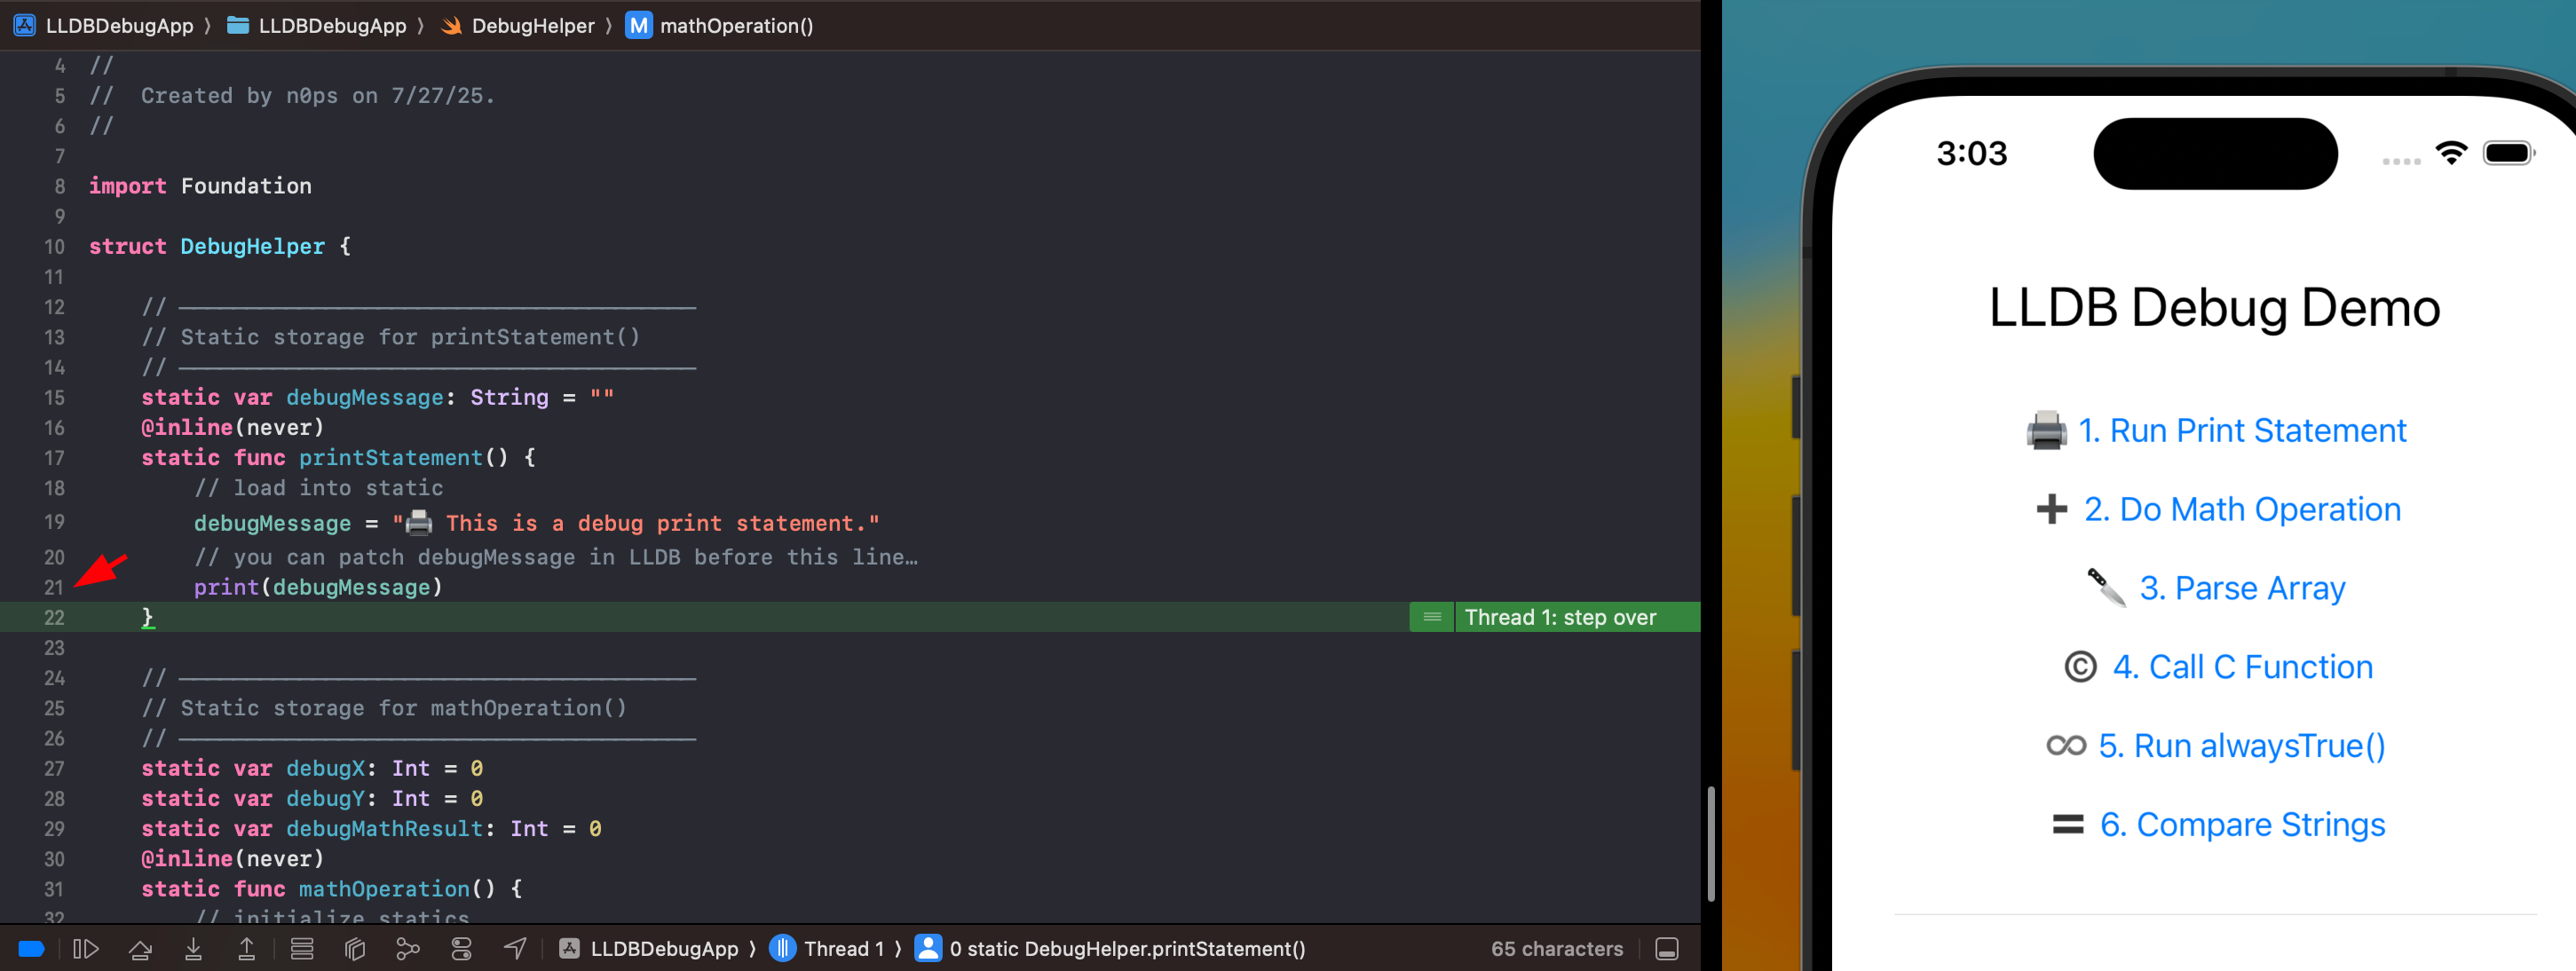
So if we look at the print statement, our goal using lldb is to change either the static var value on line 17, the debugMessage value at line 19, or the print statement at line 21 at the end of that code block.
Breakpoints
What is a breakpoint? Think of a breakpoint as pausing the execution of the application so some action can then be performed at runtime. Either inspecting, debugging, or modifying the application to alter its behavior. There are a few ways you can set a breakpoint. In Xcode, using the console, we can click line 21 and it will automatically set a breakpoint for us.
Additionally, in lldb, we can use the set keyword and our specified line with the -l flag for line, then our line number.
breakpoint set -f DebugHelper.swift -l 21
You should get the following output:
Breakpoint 5: where = LLDBDebugApp.debug.dylib`static DebugHelper.printStatement() + 164 at DebugHelper.swift:21:15, address = 0x0000000100138a38
We can search for an expression in our code such as the debugMessage string.
breakpoint set -A -p "debugMessage" -f DebugHelper.swift
Though not as granular, it will set 3 breakpoints in various locations. You can use the br list to show all breakpoints set using the command.
(lldb) br list
Current breakpoints:
6: source regex = "print(debugMessage)", exact_match = 0, locations = 0 (pending)
7: source regex = "print\(debugMessage\)", exact_match = 0, locations = 1, resolved = 1, hit count = 1
  7.1: where = LLDBDebugApp.debug.dylib`static DebugHelper.printStatement() + 164 at DebugHelper.swift:21:15, address = 0x0000000100138a38, resolved, hit count = 1
8: source regex = "debugMessage", exact_match = 0, locations = 4, resolved = 4, hit count = 5
  8.1: where = LLDBDebugApp.debug.dylib`one-time initialization function for debugMessage + 8 at DebugHelper.swift:15:39, address = 0x00000001001387b0, resolved, hit count = 0
  8.2: where = LLDBDebugApp.debug.dylib`DebugHelper.debugMessage.unsafeMutableAddressor + 12 at DebugHelper.swift:15:16, address = 0x00000001001387f0, resolved, hit count = 2
  8.3: where = LLDBDebugApp.debug.dylib`static DebugHelper.printStatement() + 12 at DebugHelper.swift:19:9, address = 0x00000001001389a0, resolved, hit count = 2
  8.4: where = LLDBDebugApp.debug.dylib`static DebugHelper.printStatement() + 164 at DebugHelper.swift:21:15, address = 0x0000000100138a38, resolved, hit count = 1
Once the breakpoint is set, the user can then begin reading variables, displaying related information for that value, or modifying it at run time. Let’s move on to a couple of different ways to do so.
Reading Variables
Once you have found your line or code block of interest, you can go about reading variables in 3 different ways. One special thing to pay attention to is that you need to hit your code of interest first before it can be displayed in the console of Xcode.
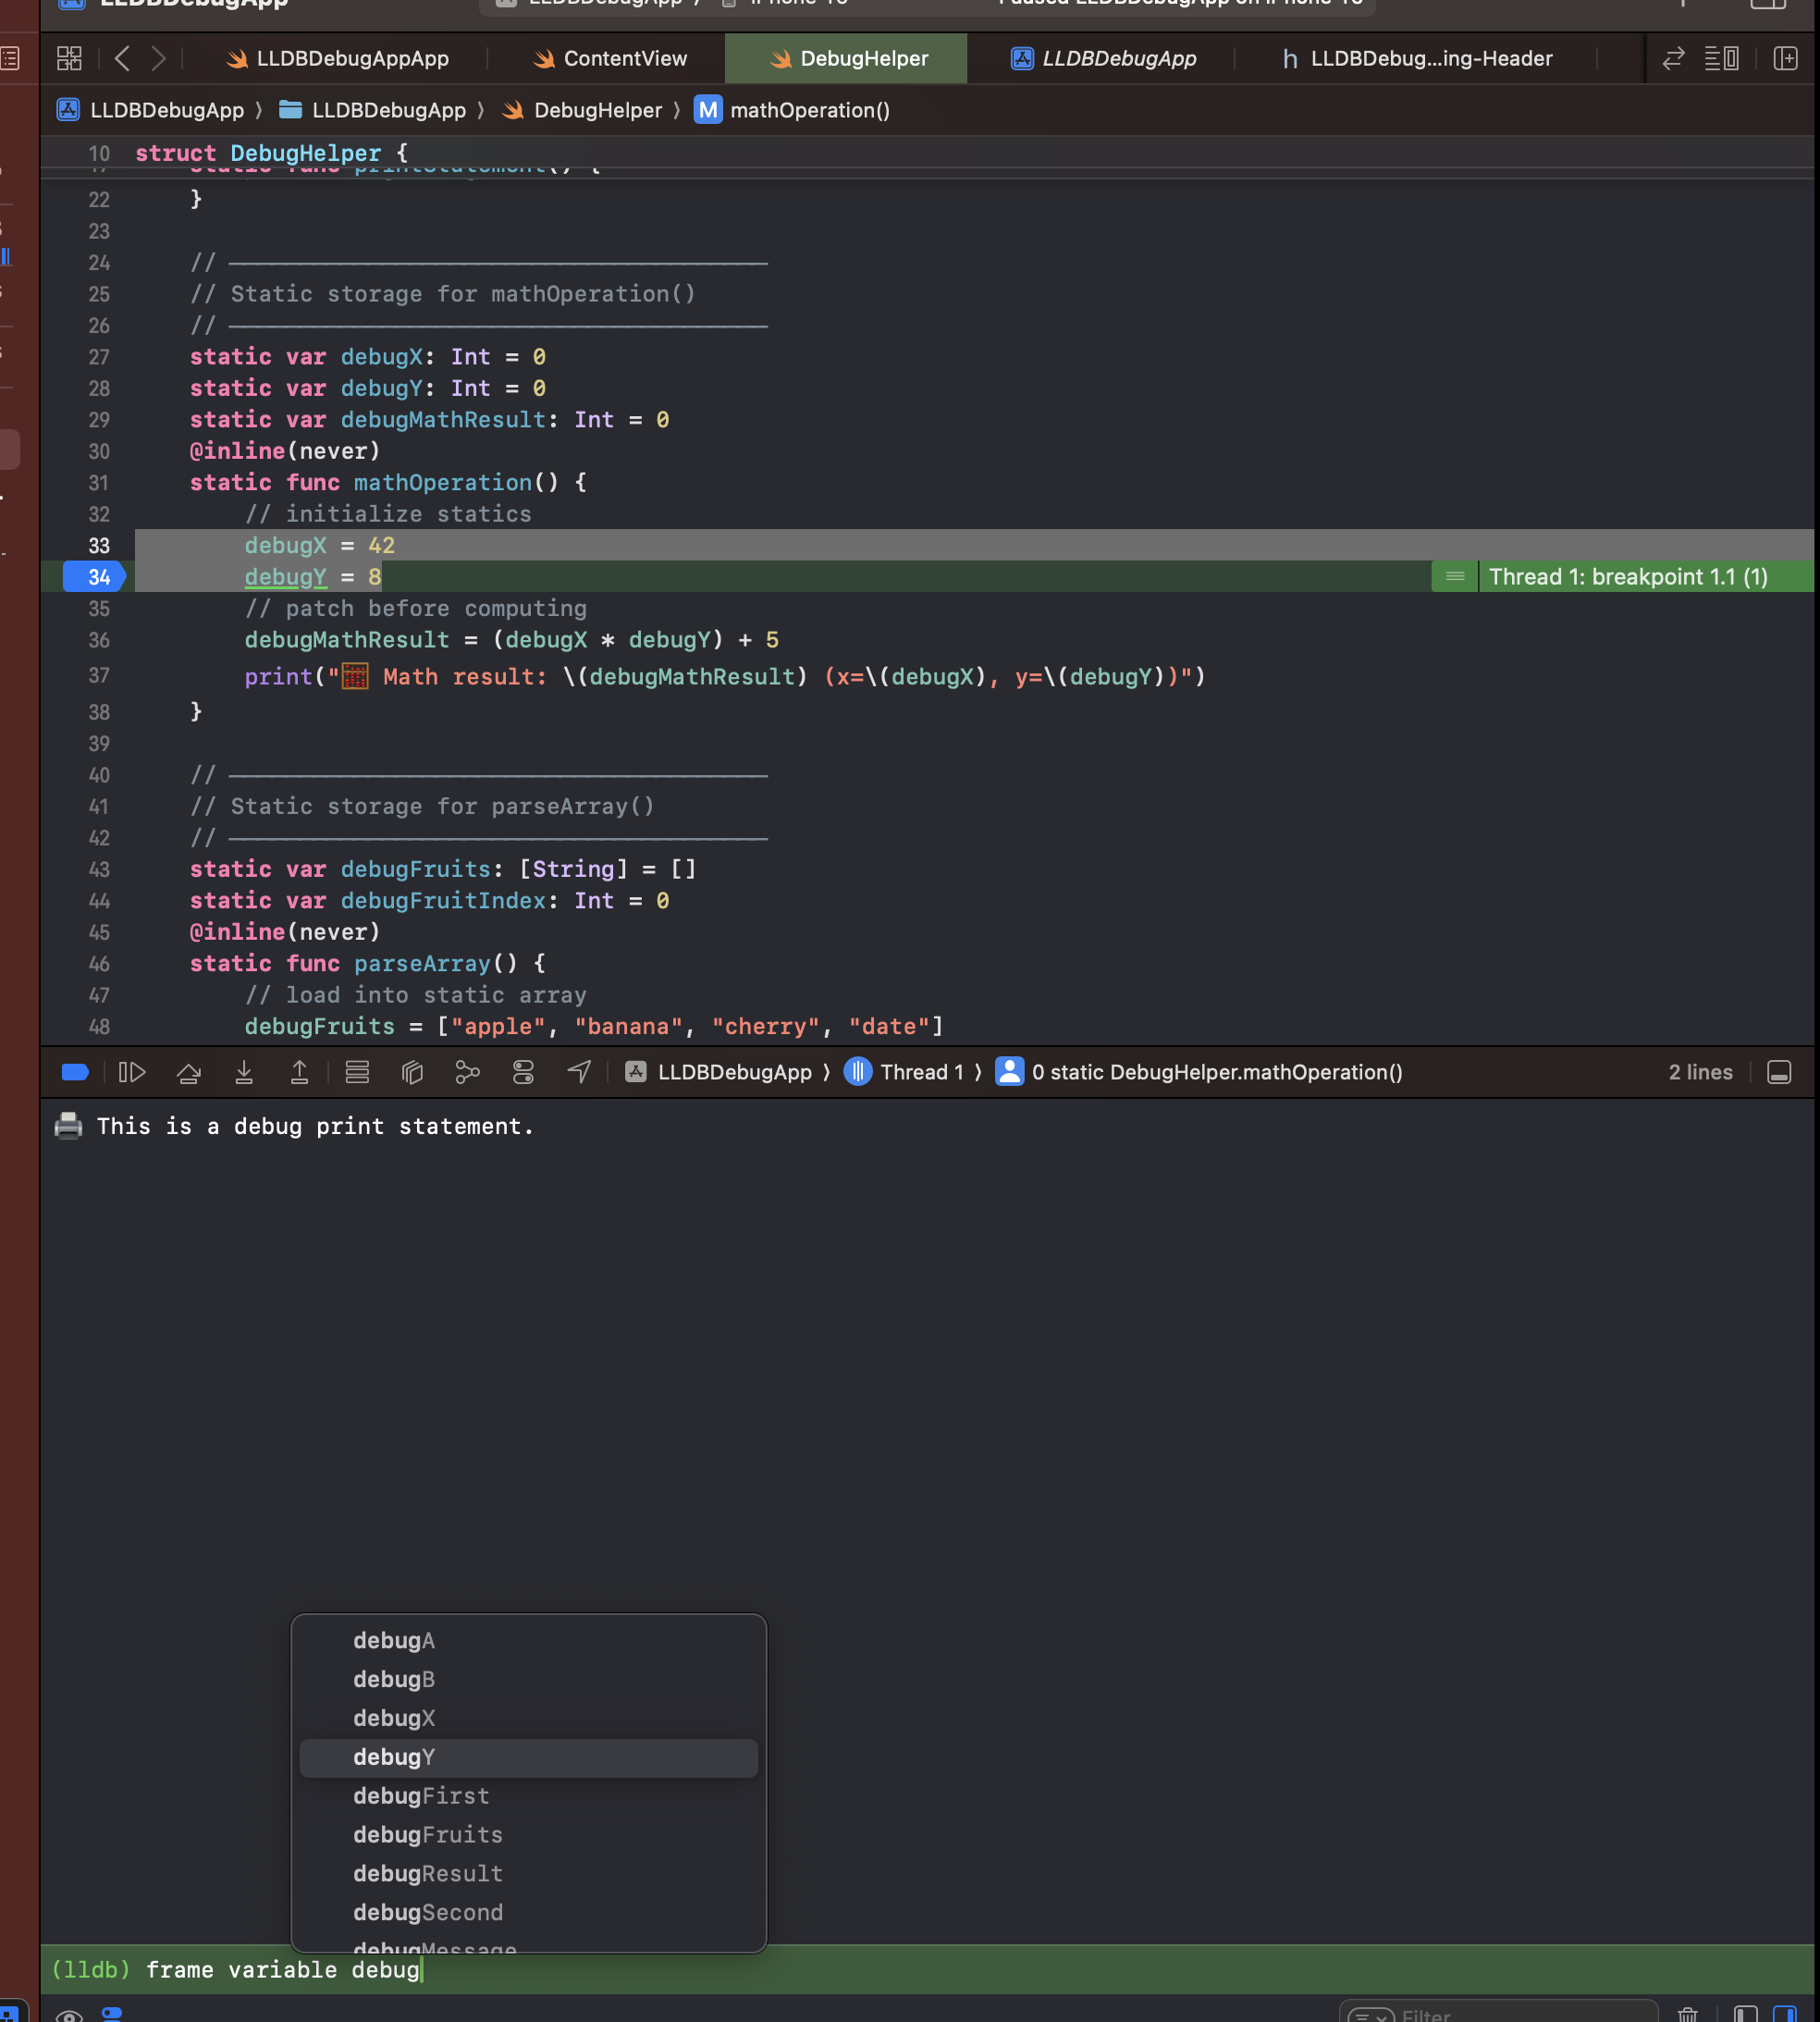
As an example, we can use the math operation function. We will need to hit lines 33 and 34 before we can modify them at runtime. We can use the three different ways of reading the frame variables.
frame variable debugX
lldb will autocomplete for you in the terminal.
You can also shorten the keywords and add more than one variable.
(lldb) fr v debugX debugY
(Int) debugX = 42
(Int) debugY = 8
This will show the variable type being acted on. The same can be done with the print object flag po.
(lldb) po debugX
42
Though it will not give you the variable type but that can be inferred from the output of the command.
Modify variables
Now that we have an understanding of setting a breakpoint in our demo app and then displaying the variable type data, we can begin the reversing process. Though not as straightforward as Frida and its subset of tools.
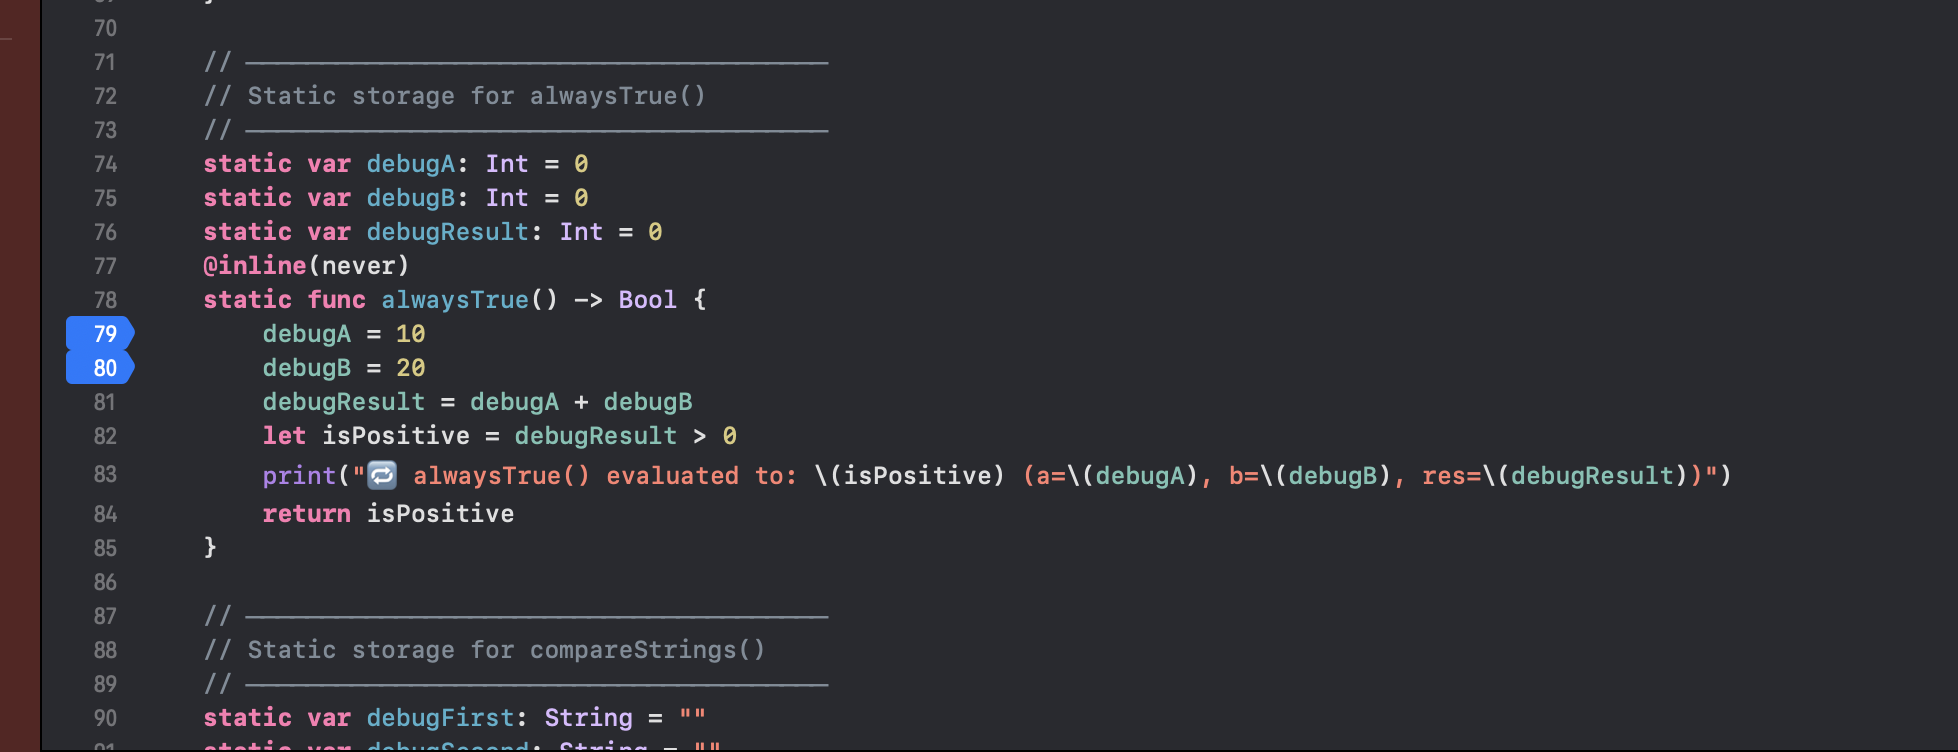
Let’s start with the alwaysTrue function. We can modify this function from two locations. Either the initial debugA Int variable, the debugB Int variable, or both. Let’s review the code block:
    static var debugA: Int = 0
    static var debugB: Int = 0
    static var debugResult: Int = 0
    @inline(never)
    static func alwaysTrue() -> Bool {
        debugA = 10
        debugB = 20
        debugResult = debugA + debugB
        let isPositive = debugResult > 0
        print("🔁 alwaysTrue() evaluated to: \(isPositive) (a=\(debugA), b=\(debugB), res=\(debugResult))")
        return isPositive
    }
Since our goal is to modify the debugA and debugB values, we will set a breakpoint on lines 79 and 80 of this code.
Notice that the variable Int values have yet to be set:
(lldb) frame v debugA debugB
(Int) debugA = 0
(Int) debugB = 0
You will need to type next or n to step through to the values being loaded in memory.
(lldb) frame v debugA debugB
(Int) debugA = 10
(Int) debugB = 0
But notice the first debugA Int is loaded in memory, not debugB. So you will need to step through once more to see both loaded in memory.
(lldb) n
(lldb) frame v debugA debugB
(Int) debugA = 10
(Int) debugB = 20
Now that we have our Int values in memory, we can begin to overwrite the values by using the expression or expr keyword. This will allow us to rewrite the expression and modify the values at runtime - similar to Frida.
Using the following and modifying debugA we can set it to the value of -100.
(lldb) expr debugA = -100
() $R0 = {}
We can then validate that the Ints value was changed.
(lldb) frame v debugA
(Int) debugA = -100
And now we see the output is changed from true to false.
(lldb) c
Process 46096 resuming
🔁 alwaysTrue() evaluated to: false (a=-100, b=20, res=-80)
Conclusion
In this post, I’ve shifted from purely showcasing Frida and Radare2 automation to demonstrating how LLDB can be used both interactively and programmatically to reverse and tweak a simple Swift iOS app. Readers with Swift experience and access to source code will find this hands-on approach a natural extension of “learning by doing,” whether on a Simulator or a jailbroken device.
Resources
My iOS application for LLDB debugging practice here. https://medium.com/@ahmedsulaiman/debugging-swift-code-with-lldb-b30c5cf2fd49 https://medium.com/@dubemike/level-up-your-debugging-skills-with-lldbs-v-p-and-po-commands-fec76c1ffee https://swiftrocks.com/using-lldb-manually-xcode-console-tricks https://rderik.com/blog/using-lldb-for-reverse-engineering/